This page is a work in progress. This info box will be removed when it's complete. |
Key Performance Indicators (KPIs) are high level measurements of the status of the supply chain. KPIs are sourced from underlying metrics and transactional information within the supply chain. This document defines common KPIs that provide high level measurement as well as a minimum set of metrics that collect information from the point of service transaction.
Below are popular KPIs that are collected and reported in Supply Chains in global health. There are many other categories of KPIs that can be used in supply chain in key areas: cost, product quality, data quality/accuracy, cold chain, and more. Here we highlight some of the most widely used periodic indicators that can help monitor and improve on-going supply chain performance.
| Key Performance Indicator | Definition | Source |
|---|---|---|
| Stock out rate | This indicator helps to measure stock availability (or lack thereof) during a specified period. Usually calculated as the %age of facilities stocked out (zero stock available) of a certain product or a set of tracer products. Measured on the day of the assessment (reporting day or day of visit). | [1], [2] as indicator 4.0 |
| Stock level | This indicator provides an overall measure of how much stock is available and whether stock levels of products are adequate. Usually reported on a periodic basis (such as a monthly report). Typically there is a minimum and maximum pre-defined for each product at each facility. Low stock is below the minimum. Excess stock level is above the maximum. | [1] |
| Stocked according to plan (SATP) | This indicator measures the percentage of health facilities or stores maintaining appropriate (as defined by local policies) levels of product stock during a particular time frame, as compared to the overall number of facilities in the area. Stocked according to plan (SATP) is defined as stock levels between set minimum and maximum levels. (See also Full Stock Availability, FSA in [3]) | [3] |
| (Vendor) On time delivery | This indicator measures the supplier’s compliance with the agreed delivery time. Usually calculated as the # of orders in which the supplier was in compliance with the agreed delivery time divided by the total # of orders. Usually reported for a specific period (eg, each month). | [1] |
| On time in full (OTIF) | This indicator measures the supplier’s compliance with the agreed quantities and agreed delivery time. Usually calculated as the # of orders in which the supplier was in compliance with the agreed quantities and delivery time divided by the total # of orders. | [1], [2] as indicator 3.1, [3], [4] as 'Perfect Order Fulfillment' Reliability metric RL1.1 |
% of emergency orders | This indicator measures the percentage of purchase orders (POs) or contracts that are issued as emergency orders compared to all PO's or contracts placed during a defined period of time. | [1], [2] indicator 2.3 |
| Reports submitted on time / Reporting rate | This indicator measures the facility reporting rates within the LMIS system to the central level and the completeness of the reports. Usually measured as a percentage of facilities that submitted a complete report by the due date for the reporting period. | [1] |
| Forecast accuracy (Forecasted demand ratio) | This indicator measures the percentage difference between forecasts developed for the previous year and the actual consumption (or issues data) for that year. Usually calculated as the difference between forecast and actual consumption divided by the actual consumption. | [2], [3] as 'Forecasted demand ratio' |
| % of facilities visited | This indicator assesses whether clear, transparent supervision guidelines that include supply chain management are operational and administered in coordination with performance management processes. Usually calculated as the number of facilities receiving supervision visits during a time period divided by the total number of facilities. | [2] as indicator 10.2 |
Interagency Supply Chain Group Harmonization of Key Performance Indicators (March 2015)
http://lifesavingcommodities.org/wp-content/uploads/2016/04/KPI-brochurefinal-Jan2016.pdfLaboratory samples/specimens often require transport to a laboratory for testing, and then results must be dispatched back to the health care provider and patient. Lab specimen supply chains have their own KPIs and SOPs. Furthermore, lab samples often require their own workflows and have unique data collection in patient systems (like EMRs). As OpenHIE integrates more of these systems including laboratory systems and supply chains, it's important to be aware of the unique needs for lab systems.
For background info on Lab Specimen networks see GLI Guide to TB Specimen Referral Systems and Integrated Networks http://www.stoptb.org/wg/gli/assets/documents/gli_guide_specimens_web_ready.pdf. For KPIs, see Annex F (page 66) which presents a Framework of Indicators with concise definitions.
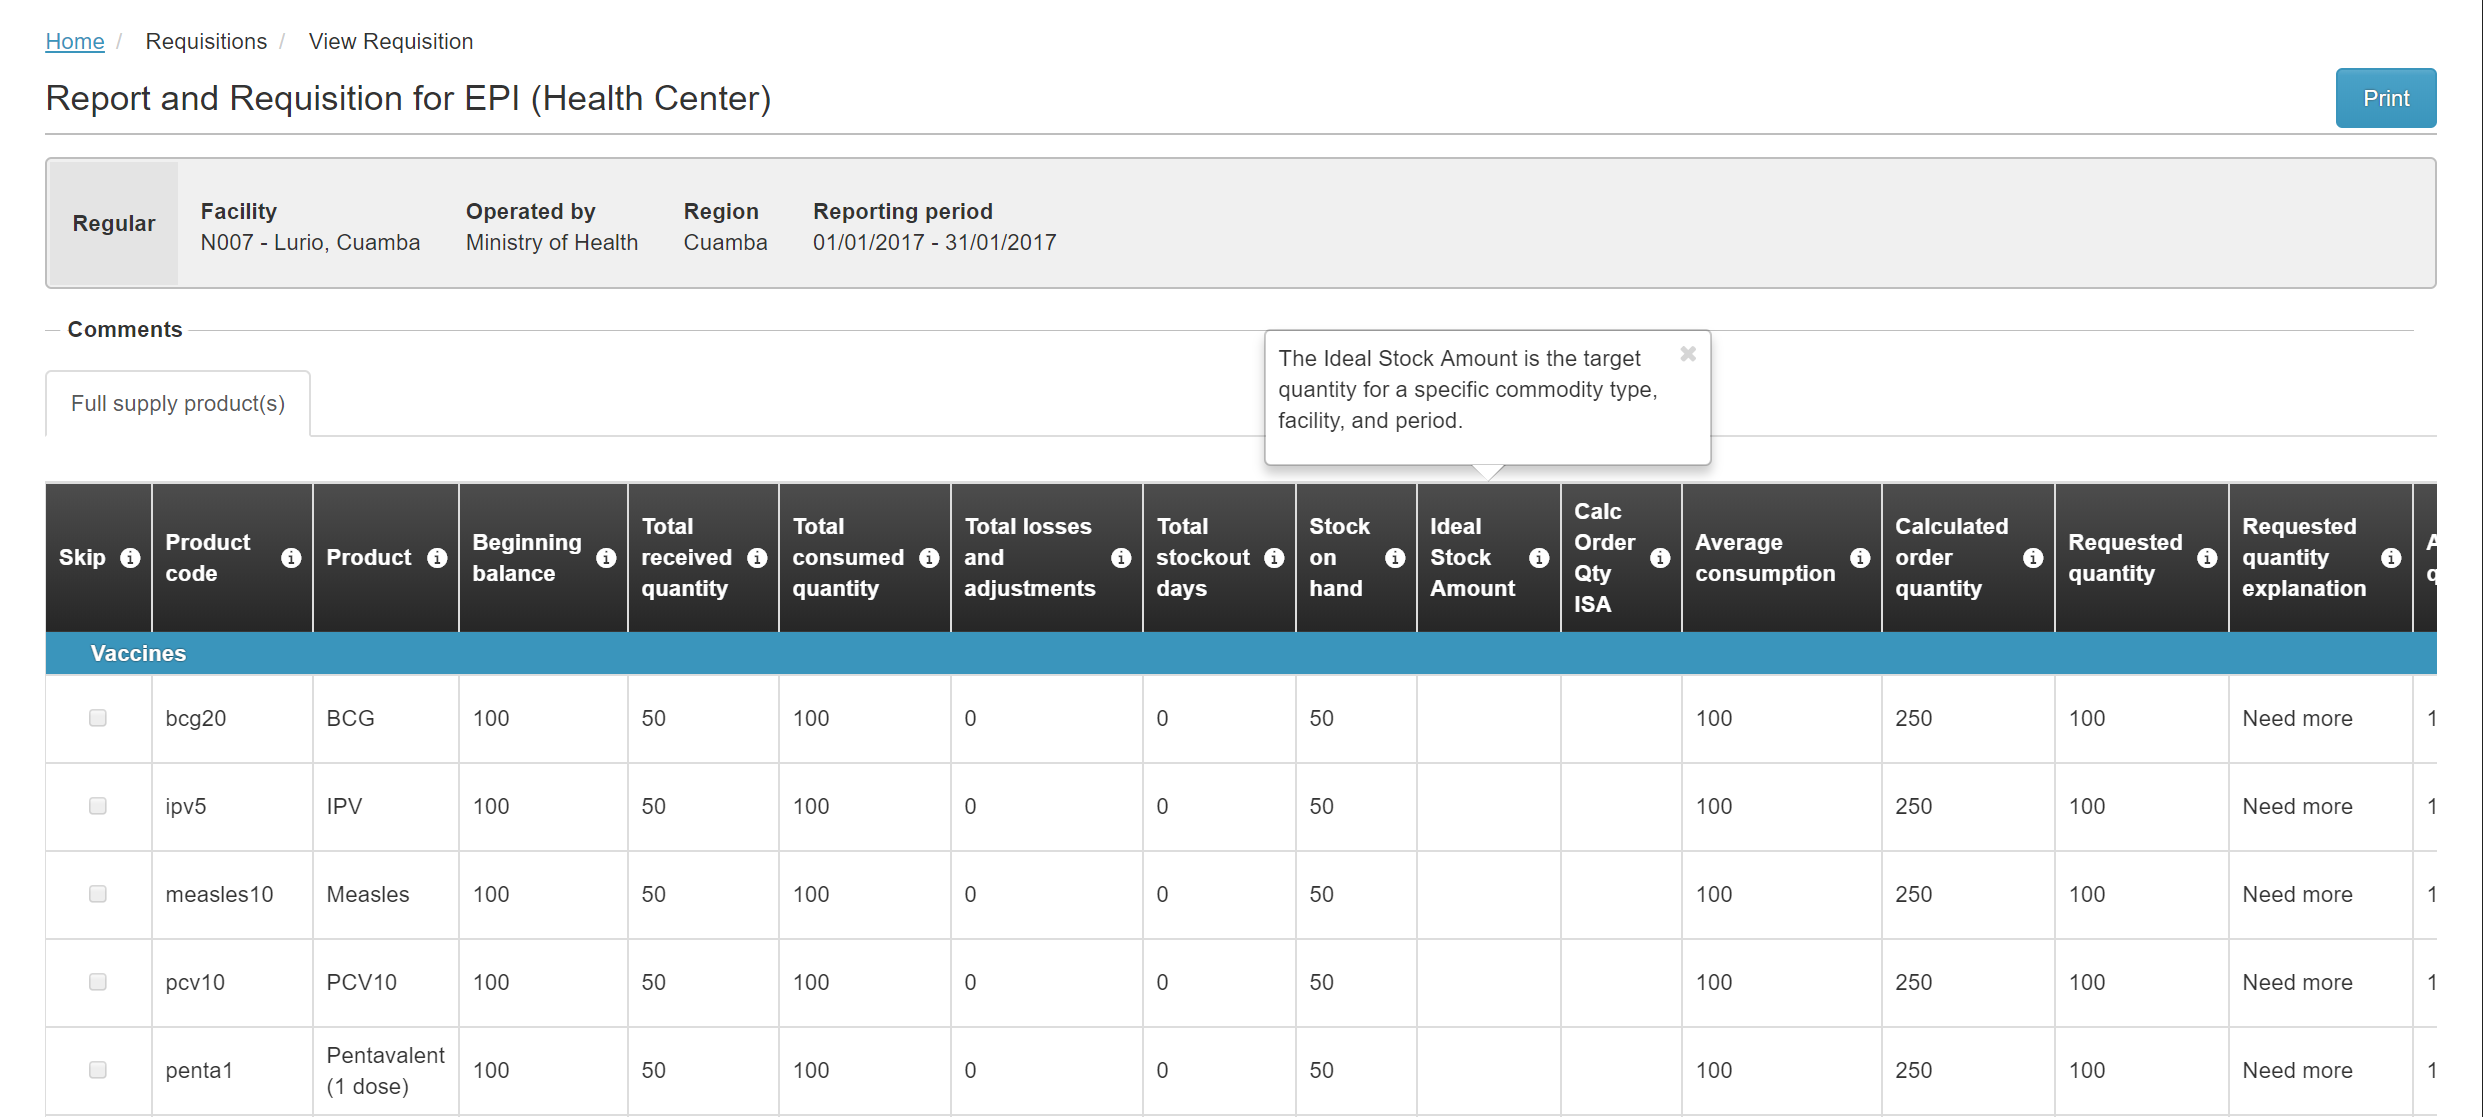
The view above shows the fields from the requisition that need to be mapped to the metrics. This work has already been done for the OpenLMIS reporting stack.
Sample Requisition Screenshot from OpenLMIS:

Below is the list of indicators that our DHIS2 integration will support. Each one is calculated per product, reporting period, facility, and program.
This metric evaluates the status of stock for each line item. Four values are returned Stockout, Understocked, Adequately Stocked and Overstocked. Below describes how these metrics are calculated against the core Requisition source data:
The amount from the totalReceivedQuantity field on the requisition line item for that product, reporting period, and facility.
The amount from the totalConsumedQuantity field on the requisition line item for that product, reporting period, and facility.
The total number of days in the totalStockoutDays field on the requisition line item for that product, reporting period, and facility.